Open/Opaque findings

Based on dozens of visualizations of use of force datasets, this project comes to four major conclusions about the data available through the Police Open Data Initiative:

> There is low participation in the initiative <
> The datasets available are limited in scope <
> The datasets are inconsistent <
> The data shared raise more questions than answers <

Mobirise

Map of every police department in the country, with red dots being those that participate in the Open Data Initiative.

Low participation in Police Data Initiative

According to the federal government's 2008 Census of State and Local Law Enforcement Agencies, there are 17,986 police departments in the United States. Of those, only around 120 participate in the police data initiative. An even smaller number share their data on use of force and officer involved shooting incidents. The map at the right shows the huge number of police departments that blanket the country. The small number of participating agencies, shown in red, are almost indiscernible.

Police Data Initiative datasets are limited in scope

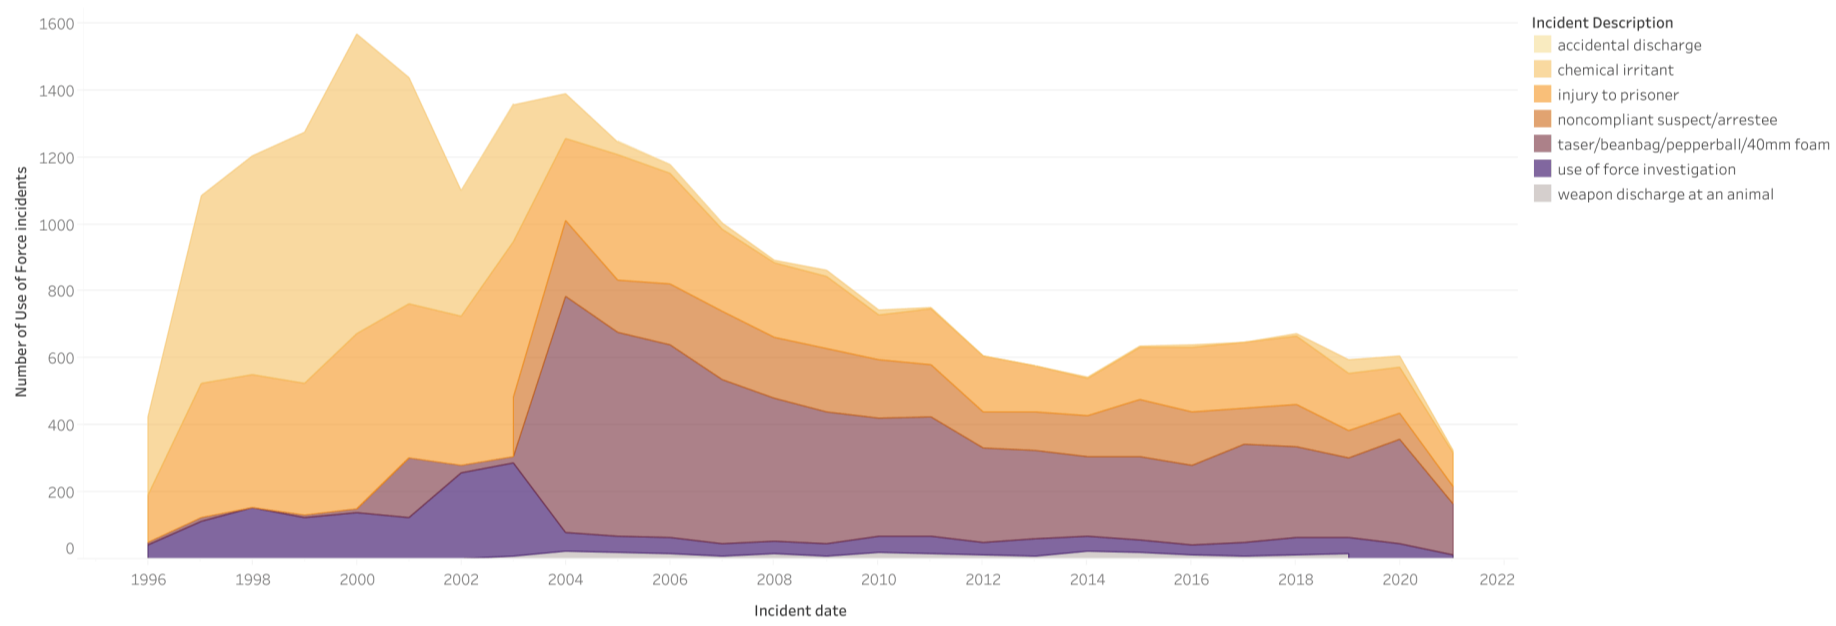
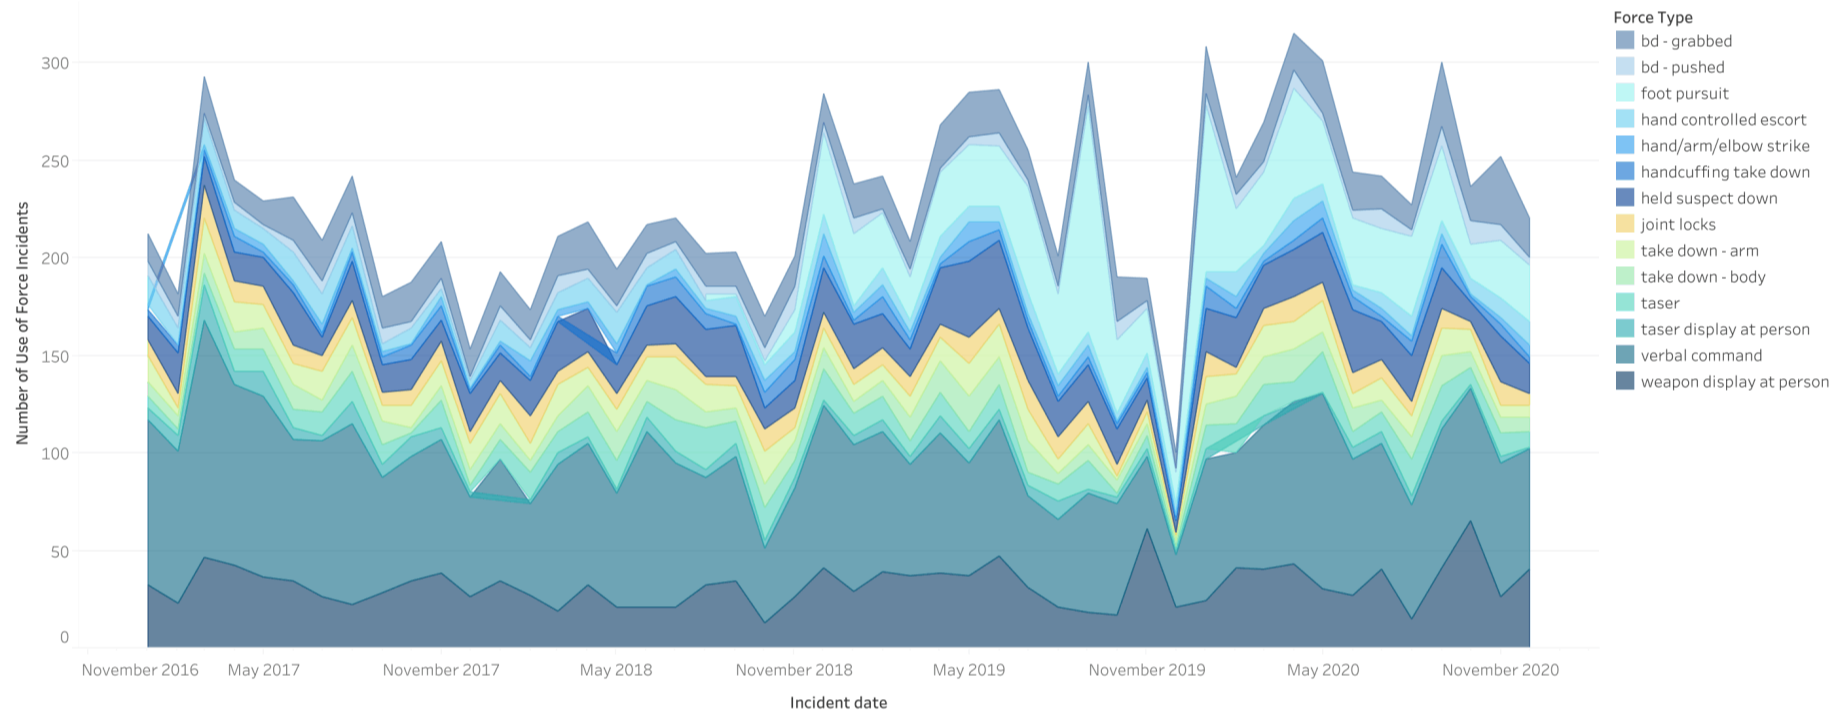
An examination of use of force datasets shared on the Police Data Initiative reveals that in many cases, the data is not thorough enough to gain meaningful insight into police use of force. For example, the Dallas, TX use of force dataset covers the years from 2016-2020. In the first visualization below, we see that use of force over this period ebbed and flowed, without any major changes in trajectory. The shaded areas, which represent the type of force used over this period, follow this overall pattern. We can contrast this graph with the second one below, representing the Cincinnati, OH dataset. In this visualization, we see that over a longer time period, descriptions of use of force shifted:  from 1996-2002, "chemical irritant" was the most common type of force used, but from 2003-2022 the predominant kind of force was described as "taser/beanbag/pepperball/40mm foam." While this might not represent a change in police tactics (pepperball being a form of chemical irritant), it does mark an interesting change in how Cincinnati police officers were classifying their force.

Visualization of Dallas use of force cases

Dallas use of force description over time (2016-2020)

Visualization of Cincinnati use of force over time

Cincinnati description of use of force over time (1996-2022)

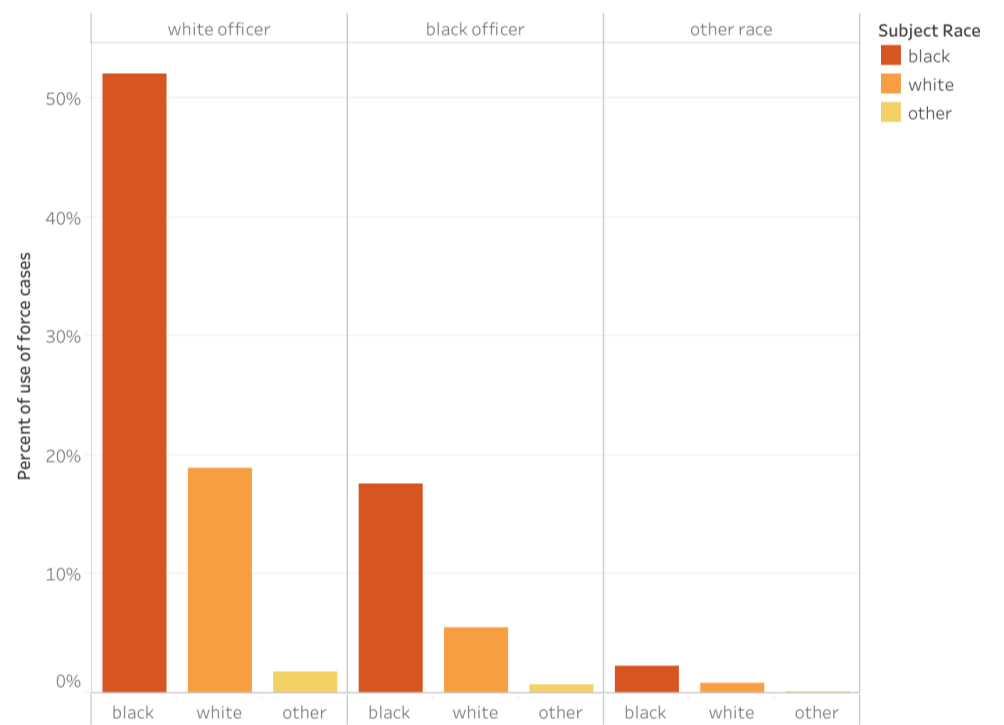
Visualization of Cincinnati use of force cases: officer and subject race

Cincinnati: race of officers and subjects involved in use of force incidents

Police Data Initiative datasets are inconsistent (part 1)

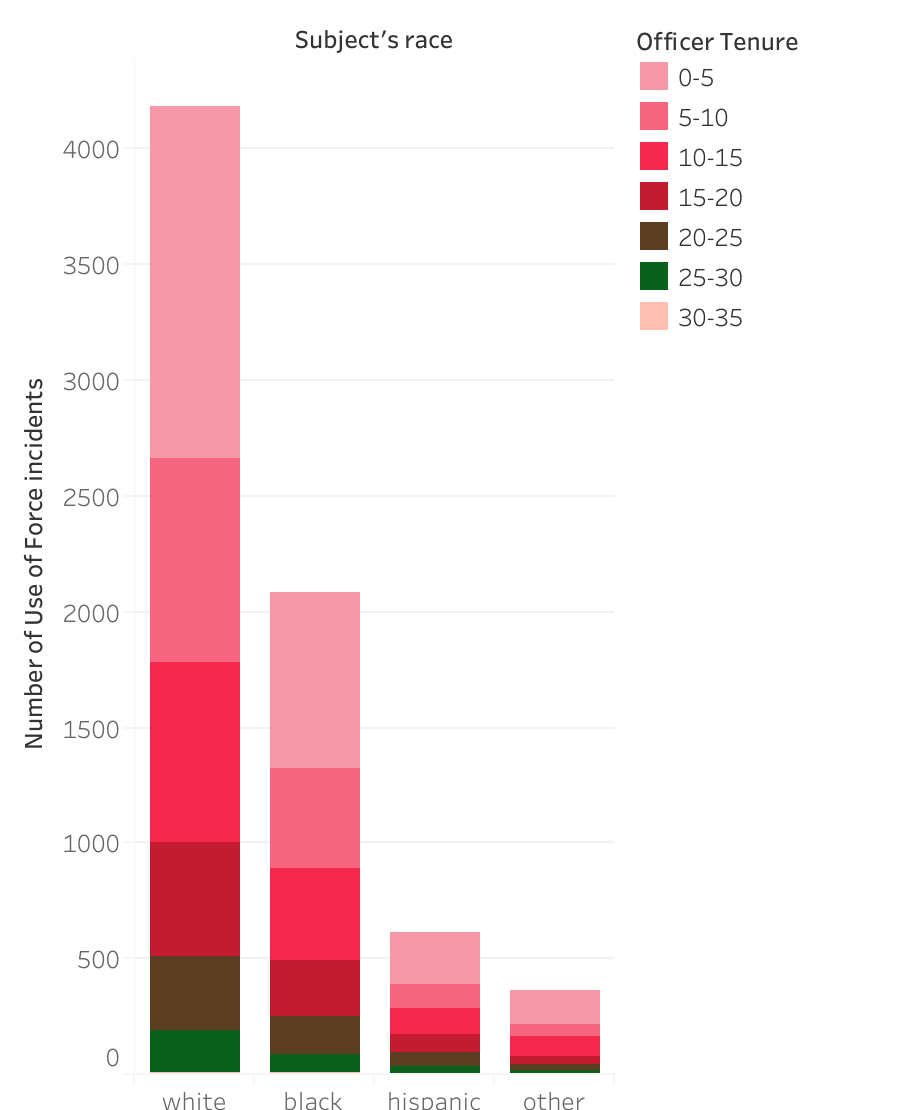
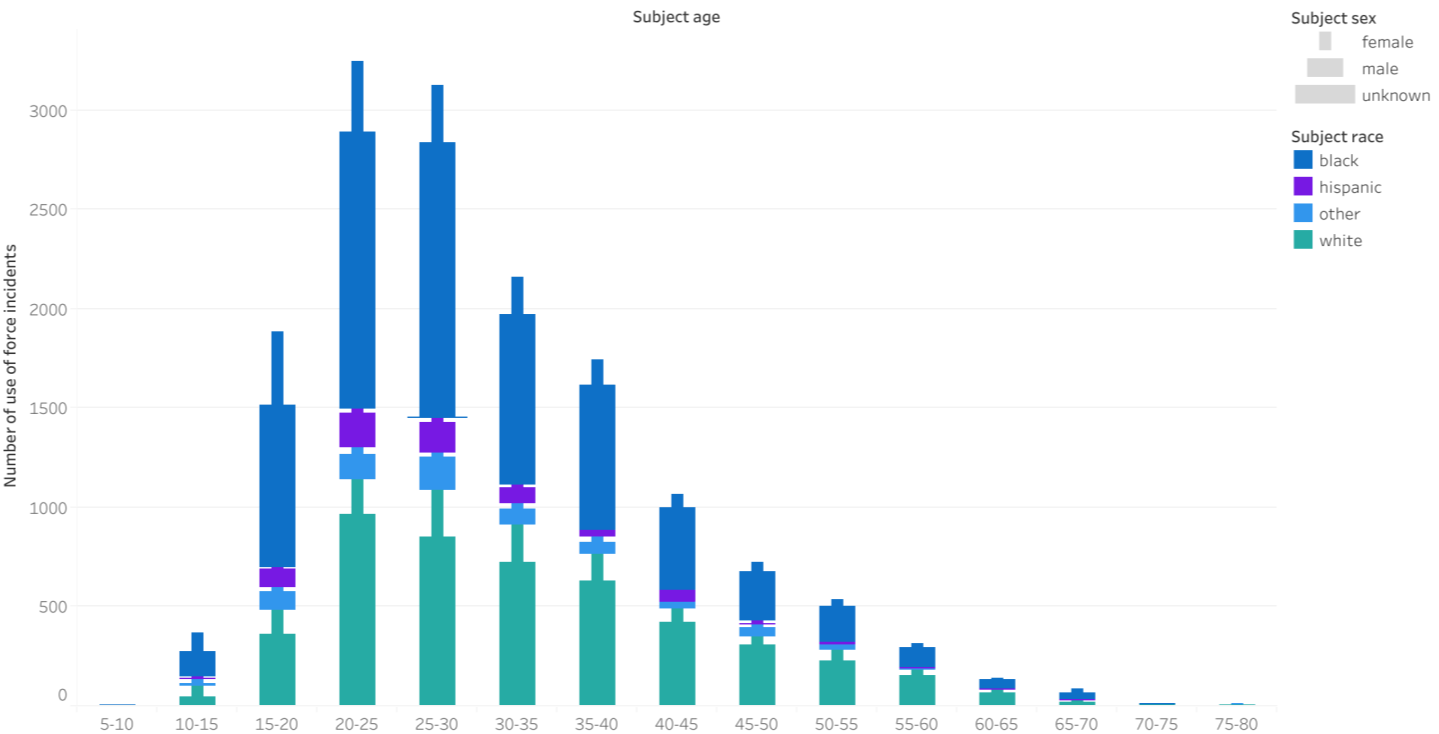
The amount and type of information collected about the officers and subjects involved in use of force cases varies widely across the datasets available on the Police Data Initiative website. Some datasets include the age, race, and gender of the subject and officer while others have detailed demographic information for just the subject. In the datasets that have both officer and subject details, we can observe startling disparities like the one at left: in Cincinnati over 50% of the use of force cases involved a black subject and a white officer. In Portland, OR, we can't tell whether there is a similar disparity in officer race, because they don't collect that information. On the other hand, Portland provides data on the officer's tenure, where many other cities do not, showing that newer cops are more often involved in use of force. Indianapolis, IN collects the most subject demographics; race, sex, and age. Black men between the ages of 20-30 make up the largest group of subjects of use of force in that city. The lack of comparable information across datasets makes it difficult to compare use of force across cities or to identify trends common to all data.

Visualization of Portland use of force cases: officer tenure and subject race

Portland: tenure of officer and race of subject involved in use of force case

Visualization of Indianapolis use of force cases: subject age, race and sex

Indianapolis: Age, race, and gender of subject involved in use of force case


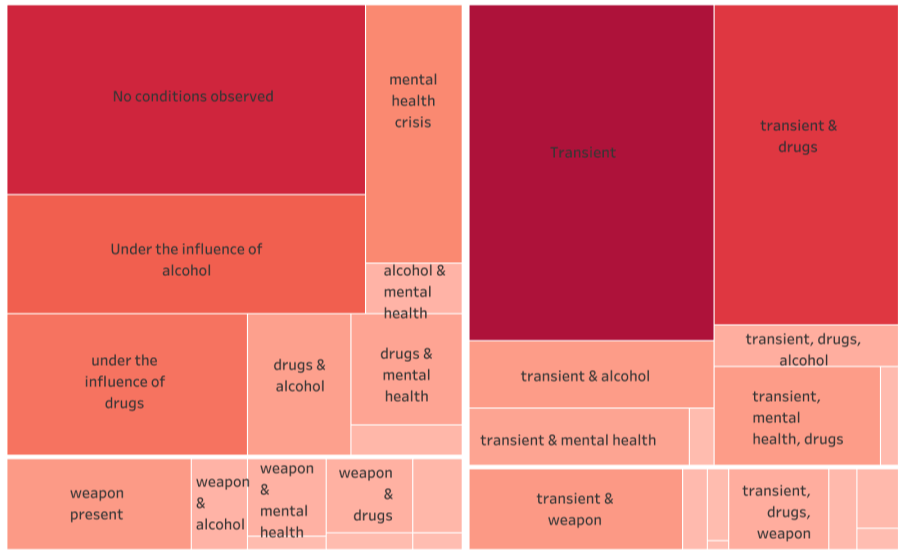
Visualization of conditions observed by police in subjects in use of force cases

Portland: conditions observed by police for subjects of use of force

Police Data Initiative datasets are inconsistent (part 2)

Some cities represented in the repository have many more data points for subjects of use of force. The Portland, OR dataset includes yes/no fields for a number of different conditions that might be observed in subjects: if they appear to be transient, under the influence of drugs or alcohol, or experiencing mental health crisis. While this data might be helpful, it is also important to ask what the standards for such observations are and what role the answer to these questions plays in justifying officer use of force.

Police Data Initiative data raises more questions than answers

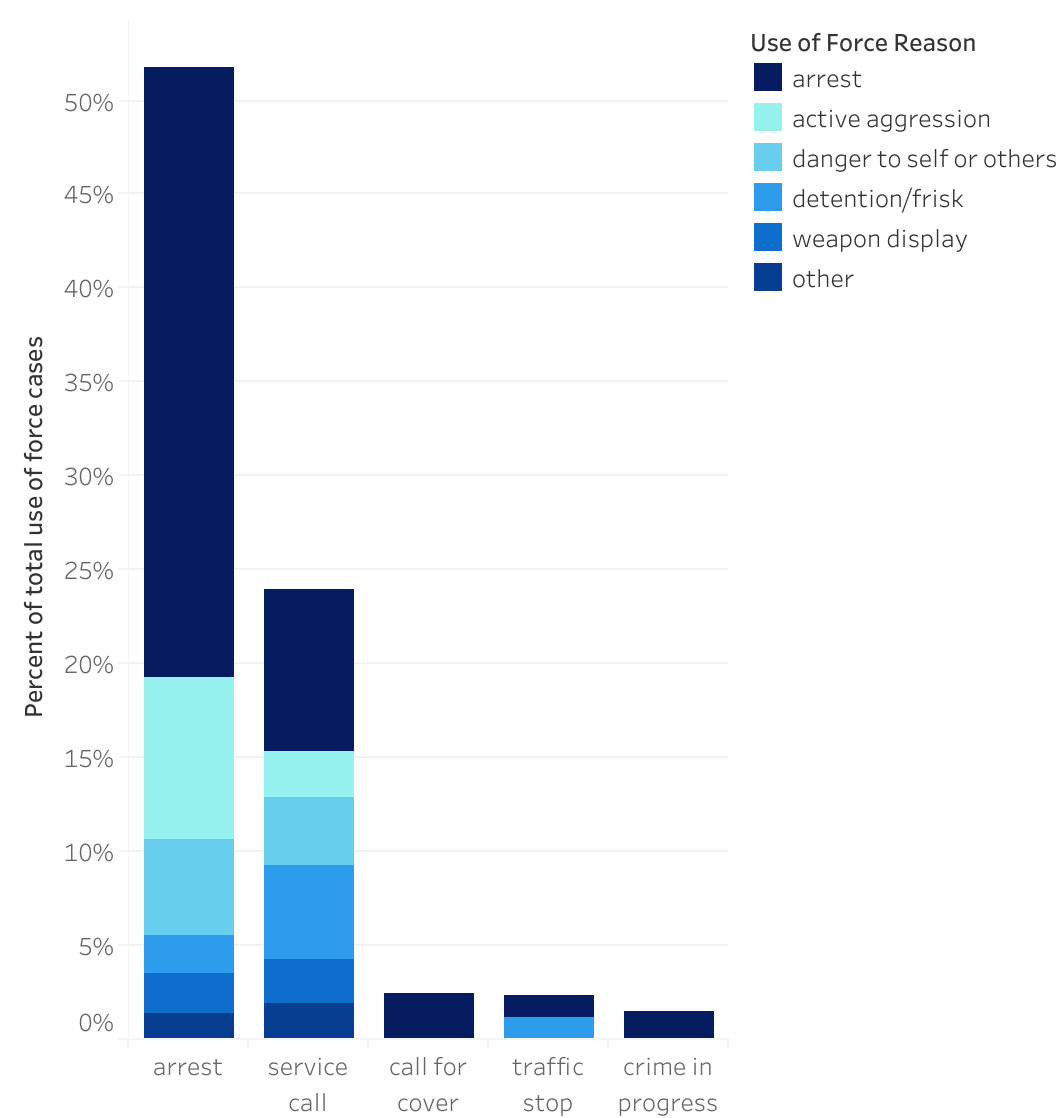
The Portland, OR visualization above raises questions about the reason and meaning behind specific information shared through the Police Data Initiative. Similarly, the visualizations below demonstrate the fact that data often obfuscates rather than reveals. Both graphs show the percent of use of force cases based on the initial "service type" (aka initial reason for the police encounter) and then further broken down by reason for use of force. Dallas, TX data is shown on the left and Indianapolis, IN data is represented on the right. In both cities, "arrest" was the predominant service type for use of force incidents, and within that "arrest" was the most common reason for use of force. This tells us nothing about either the reason for the initial police encounter - arrest is a broad reason that covers everything from littering to murder - or the need for force since arrest on its own is not a justification. The data is opaque despite its supposed openness.

Visualization showing Indianapolis use of force service type and reason for force

Indianapolis use of force incidents: initial service request and reason for use of force

Visualization showing Dallas use of force initial service type and reason for arrest

Dallas use of force incidents: initial service request and reason for force

© Copyright 2022 Anna Robinson-Sweet

Develop your own web page with Mobirise